Understanding Step Response Graphs

0 Members and 1 Guest are viewing this topic. Read 10720 times.

Rocket_Ronny

  • Full Member
  • Posts: 1415
  • Your Room Is Everything - Use It Well.
    • ScriptureSongs.com
Understanding Step Response Graphs
« on: 11 Jan 2011, 04:12 am »

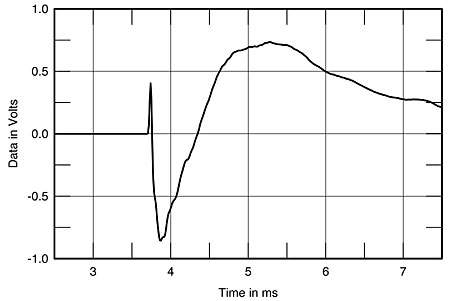
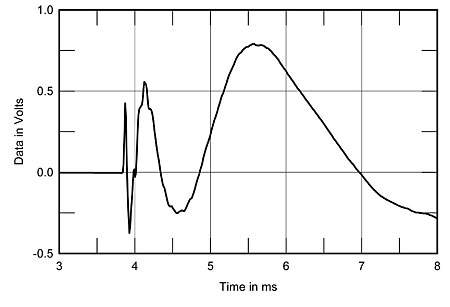
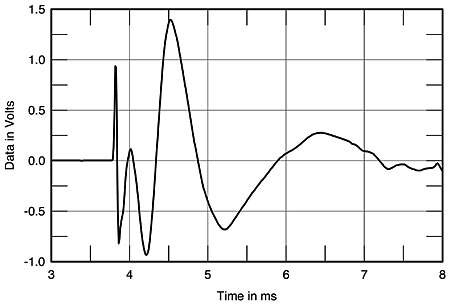
Here are three different Step Response Graphs found on Stereophile. Let's hear how you understand what they mean. Does one show better performance than the other, etc, why? What does the graph show in reality?


Peak Consulting El Diablo Speaker  $65,000.00


Pioneer S-1EX Speaker  $9,000.00


WaveForm Mach 17 Speaker  $12,000.00


Rocket_in step_Ronny


JohnR

Re: Understanding Step Response Graphs
« Reply #1 on: 11 Jan 2011, 04:21 am »
Is the Vandersteen one a step response or an impulse response?

Rocket_Ronny

  • Full Member
  • Posts: 1415
  • Your Room Is Everything - Use It Well.
    • ScriptureSongs.com
Re: Understanding Step Response Graphs
« Reply #2 on: 11 Jan 2011, 04:46 am »

Yes John, that was a impulse response. I put up the wrong graph.

I replaced it with a Step Response for the out of business WaveForm Mach 17.

I actually came very close to buying the WaveForms when John closed the doors.


Rocket_step response - phase aligned - impulse ready_Ronny
« Last Edit: 11 Jan 2011, 04:33 pm by Rocket_Ronny »

*Scotty*

Re: Understanding Step Response Graphs
« Reply #3 on: 11 Jan 2011, 05:19 am »
Step Response graphs tell you whether the design is time or phase coherent,they also indicate how well the drivers tend to hand off to one another.
  They do not however tell you what a loudspeaker sounds like.
Here are what graphs of phase-coherent designs look like on their designed listening axis.
This is the Dunlavy Labs SC-IV/A.

The step response.
 
The impulse response graph.
 
The square-wave response.
 
Link to Stereophile review of Dunlavy Labs SC-IV/A
http://www.stereophile.com/content/dunlavy-audio-labs-sc-iva-loudspeaker-measurements-part-3
Scotty

Rocket_Ronny

  • Full Member
  • Posts: 1415
  • Your Room Is Everything - Use It Well.
    • ScriptureSongs.com
Re: Understanding Step Response Graphs
« Reply #4 on: 11 Jan 2011, 04:36 pm »

Thanks Scotty:

Quote
Step Response graphs tell you whether the design is time or phase coherent,they also indicate how well the drivers tend to hand off to one another.


So how does the graph tell you this?
There is volts on the left and time on the bottom.
What does it mean when you get a mountain range?


Rocket_invert phase_Ronny

JoshK

Re: Understanding Step Response Graphs
« Reply #5 on: 11 Jan 2011, 04:42 pm »
I admit, I don't know what a step response graph is.  I am familiar with FR and impulse response graphs (and CSD and even wavelet transforms). What is the input signal in a step response graph?

JoshK

Re: Understanding Step Response Graphs
« Reply #6 on: 11 Jan 2011, 04:48 pm »
haven't read it all myself, but here is an explanation.  I now see what the difference in input signal is between the impulse and step, but don't yet see why the step would tell you anything different.

http://en.wikipedia.org/wiki/Step_response

*Scotty*

Re: Understanding Step Response Graphs
« Reply #7 on: 11 Jan 2011, 06:46 pm »
 Rocket_Ronny,Here are links to articles on group delay and transient response. As well as articles by John Atkinson on what loudspeaker measurements may say about how a loudspeaker sounds.
They say a picture is worth a thousand words and that is certainly the case when it comes to understanding what a step response graph illustrates.
  http://www.linkwitzlab.com/frontiers.htm#F
Understanding Phase Distortion
http://www.ocf.berkeley.edu/~ashon/audio/phase/phaseaud2.htm

http://www.stereophile.com/content/measuring-loudspeakers-part-one
http://www.stereophile.com/content/measuring-loudspeakers-part-two
http://www.stereophile.com/content/measuring-loudspeakers-part-three
Scotty

Rocket_Ronny

  • Full Member
  • Posts: 1415
  • Your Room Is Everything - Use It Well.
    • ScriptureSongs.com
Re: Understanding Step Response Graphs
« Reply #8 on: 11 Jan 2011, 09:08 pm »

 :dance:

JohnR

Re: Understanding Step Response Graphs
« Reply #9 on: 12 Jan 2011, 11:53 am »
I'm still not quite sure what you can really usefully read off a step-response graph, other than when (like an impulse response) it's exemplary (as per the Vandersteen one I noted above, not there now).

Rocket_Ronny

  • Full Member
  • Posts: 1415
  • Your Room Is Everything - Use It Well.
    • ScriptureSongs.com
Re: Understanding Step Response Graphs
« Reply #10 on: 13 Jan 2011, 05:28 pm »

True enough.

I find the most important data to be the frequency response, impedance / efficiency, and spectral decay. But the king for me is the frequency response.

Anyone else want to wade in?

Rocket_Ronny