I now have in my possession a fully modded TacT S2150 amplifier. Since I already have two stock S2150 amps, I finally have the opportunity to experiment with active multi-amping.
As before, the RCS 2.2X is used to divide signal between the mains and subs with 70hz, 48dB/octave high and low pass filters. The sub output goes through the integrated DAC via a balanced cable into a Crown K2. The main outputs (all digital) go through paralleled AES/EBU and S/PDIF links to S2150 #1 (modded amp, on tweeters right now) and S2150 #2 (stock amp, on midrange), respectively. From amp #2 another S/PDIF link daisy chains to S2150 #3 (stock amp, on woofers). I will be replacing the daisy chain link, which is using a borrowed S/PDIF cable, with another parallel direct link from the 2.2X using a glass Toslink cable which should arrive in the next few days.
Previously, two discrete sets of speaker cable or one biwire set was used to connect the amplifier(s) to the external passive crossover, which then had three sets of pigtail speaker cables that connected to the binding posts of the main channel that are in turn connected directly to the individual driver groups. So it was extremely easy to bypass the passive crossover, I just disconnected it and connected each amps' outputs directly to the binding posts on the speakers.
I'm using wonderful new software for TacT called TACS. It is developed by some gurus in France and is free. It allows very flexible crossover design with semi-automatic parametric EQ, speaker correction, and level normalization. Also it has a self-contained measurement module that is vastly superior to what comes with the RCS 2.2X. It still uses the RCS to generate pulses and as mic preamp.
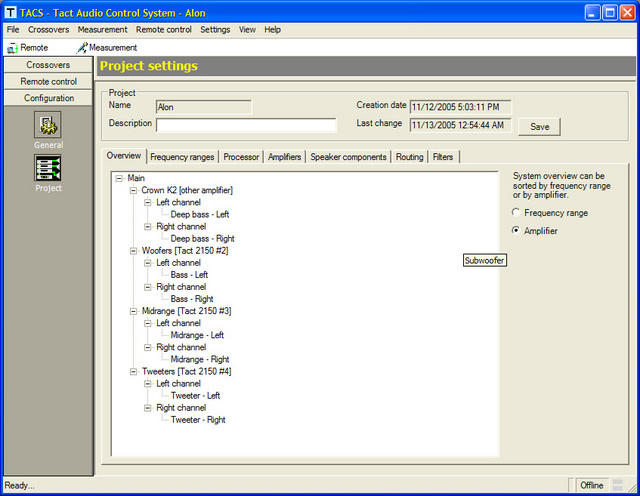
First step is to configure the TACS software to the system.
Next I measured the woofers and midranges with no crossover to check frequency response.
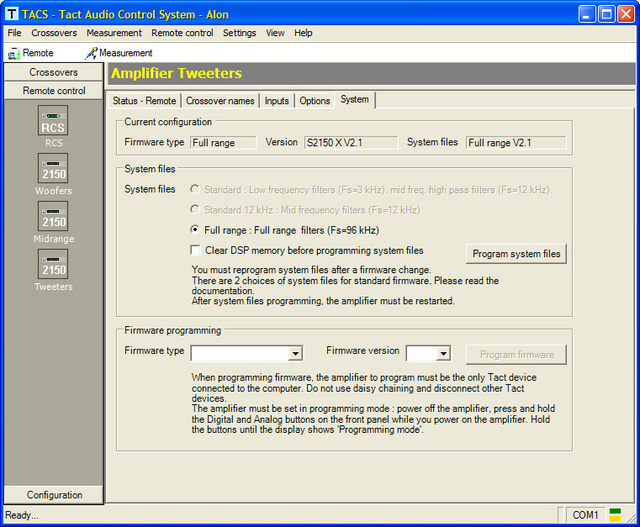
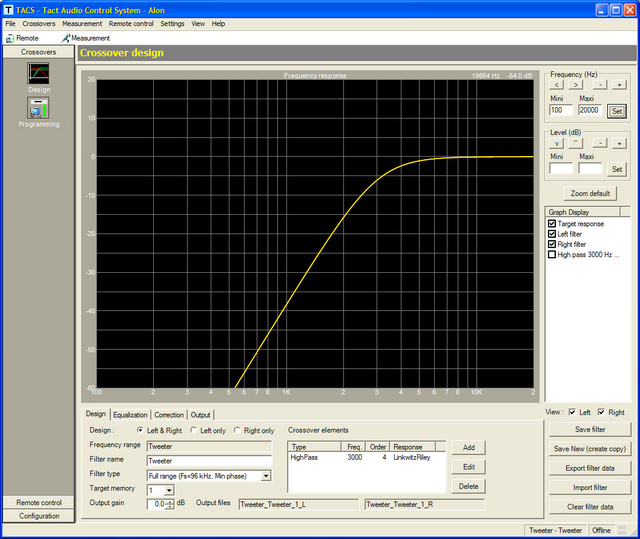
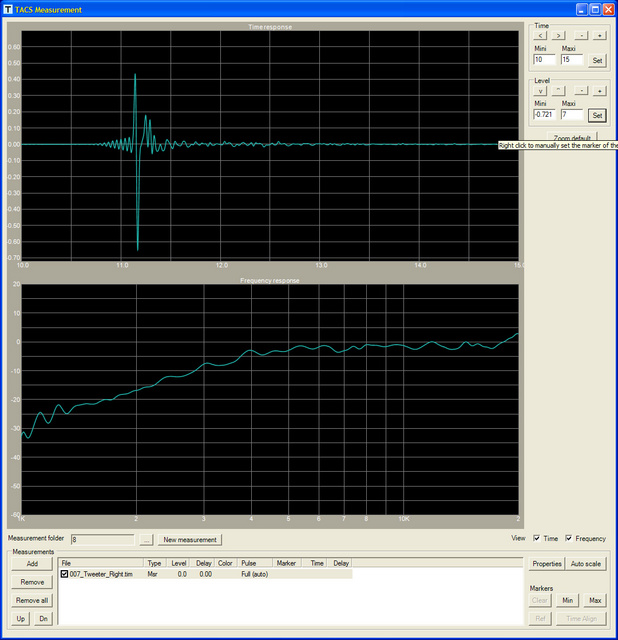
Doing this with the tweeter would probably result in 18 barbequed Raven ribbons, so the tweeters were measured with a safety crossover, 60dB/octave @ 2khz high pass. Using high frequency filters in the S2150 amps requires a reprogramming of firmware and system files; luckily the appropriate files are included with the TACS download so I did not have to buy them from TacT

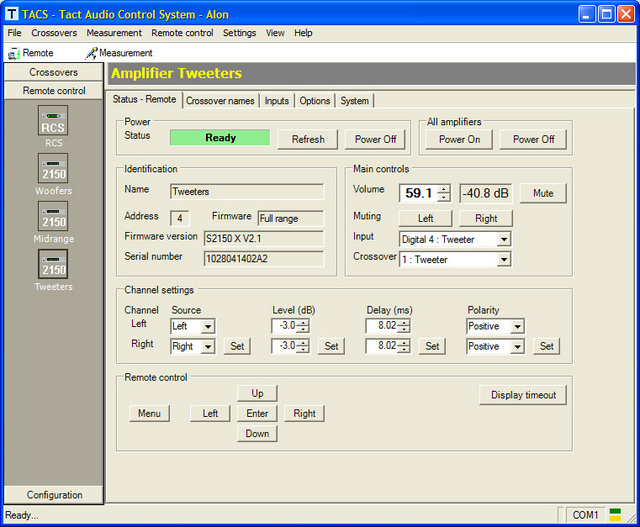
TACS fortunately has an awesome virtual remote control that lets you control the important functions of the each amp and the RCS within the software. This includes firmware reprogramming!
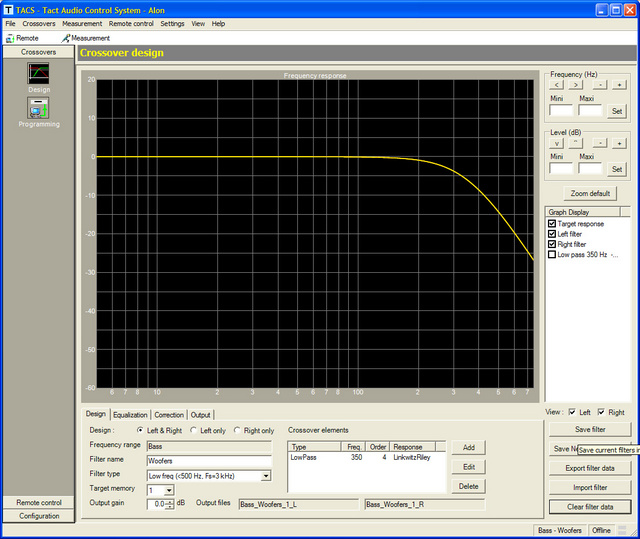
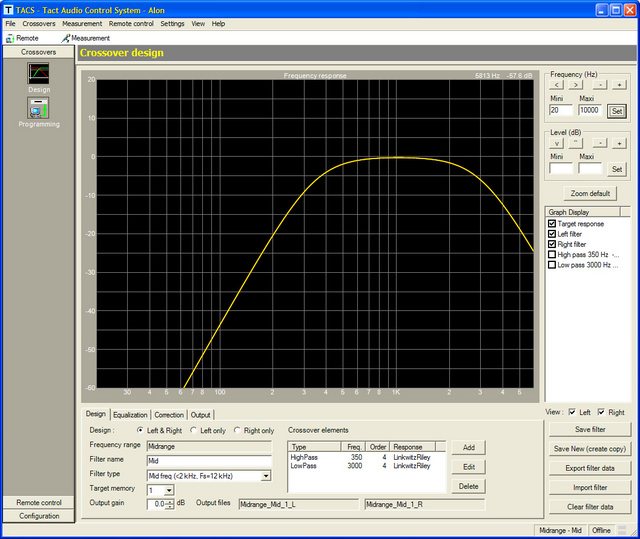
After looking at the individual driver group responses (far nearfield) I designed basic crossovers. They wound up identical to what the factory uses in the bass/mid (350hz) but I dropped the mid/tweeter a bit (3500hz to 3000hz). Also I opted for higher slopes -- 24dB/octave Linkwitz-Riley.
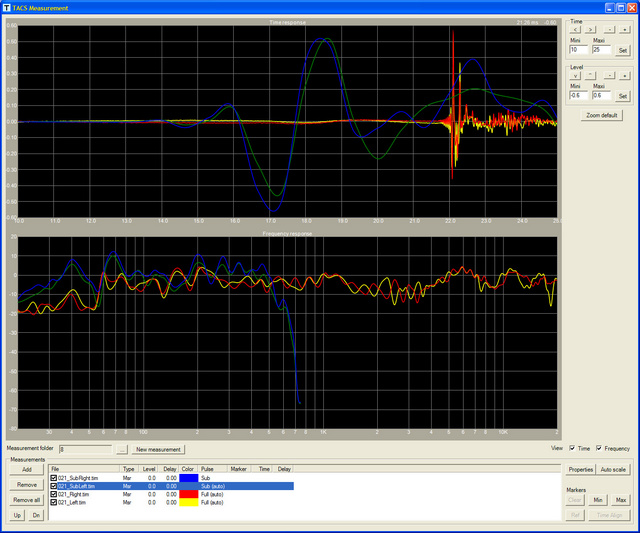
Once these crossovers were programmed into the amps, I proceeded to repeat measurements to assess time delays and impulse response.
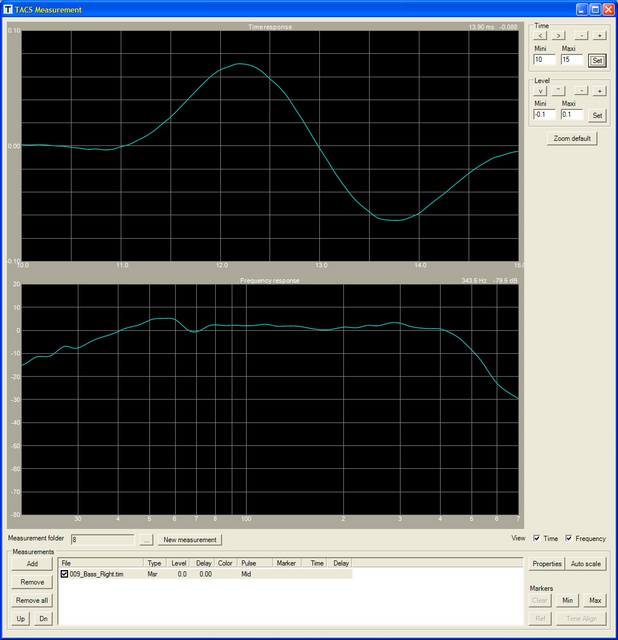
These pulses were obtained with the polarity reversed in the amps, to compensate for the mic which also has polarity reversed. From these the delays of each driver group, related to the DSP filters, are evaluated. Woofers have the most lag, followed by the midranges with the tweetesr the least lag. So delays are added to the tweeter and midrange amp to align the pulses with the woofer. This is further tweaked after additional measurements at the listening position to compensate for toe in (which alters relative distance to the mids and tweeters in the array) and vertical displacement of the woofers.
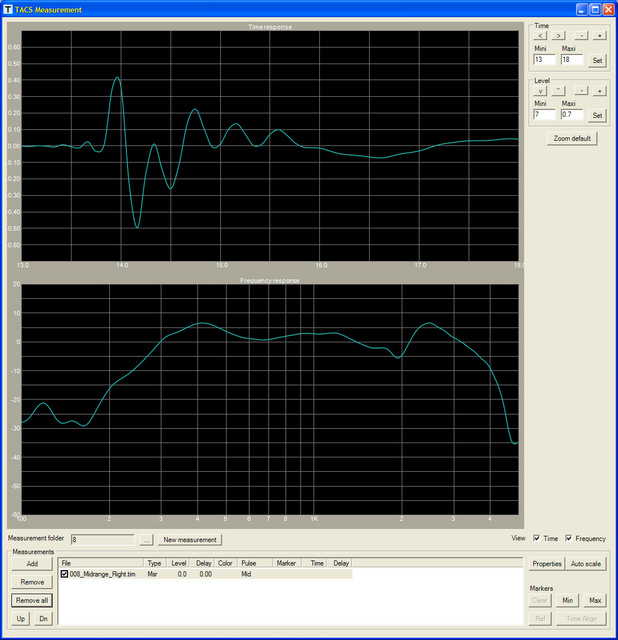
One thing to notice here is that there is measurable low frequency pre-ringing of the midrange and tweeters. I believe this to be a "feature" of DSP crossovers. Similar pattern can be seen in the measurements of the NHT xD (with XdA processor/amp -- based on DEQX technology) published in the review in the November issue of Stereophile.
TACS lets each driver group be measured with bass, midrange, or full range pulses. This helps greatly with time alignment and is a feature missing from the basic RCS software package.
Finally, a non-corrected measurement of the speaker is made at the listening position.
At this point, correction in the bass range is being implemented in the RCS as it was before the active multi-amping. I was expecting to have switched correction into the amps by this point but have been distracted by listening sessions

I will post more in the following days, but listening impressions have been very positive. There is a cohesiveness of the sound that I would have only thought impossible with a large, multi-way speaker. The treble through the modded amp is exceptionally clean and smooth, with no trace of harshness yet lots of detail and "air".
Things should be even better when the amp is fed a cleaner digital signal from a fully modded RCS 2.2X which should be here in the near future.
Much more to follow...