Using Design of Experiments for Subwoofer integration to a 2-channel system

0 Members and 1 Guest are viewing this topic. Read 957 times.

PumaCat

  • Jr. Member
  • Posts: 190
Hi Guys,
Some years back, I did a study using an experimental, statistically based technique called Design of Experiments (aka, DOE) to optinmize setup of my REL sub into my system.

For those interested, I'm posting an introduction to Design of Experiments here:
___________

About a year ago I started to look at subwoofer integration with a pair of "mains" speakers using a statistical approach called Design of Experiments to optimize integration of subwoofers for a given room with a set of "mains" speakers.

To start with here is an introduction to Design of Experiments.

Description
Design of experiments (DOE) is a powerful tool that can be used in a variety of experimental situations. DOE allows for multiple input factors to be manipulated determining their effect on a desired output (response). By manipulating multiple inputs at the same time, DOE can identify important interactions that may be missed when experimenting with one factor at a time. All possible combinations can be investigated (full factorial) or only a portion of the possible combinations (fractional factorial). Fractional factorials will not be discussed here.

When to Use DOE
Use DOE when more than one input factor is suspected of influencing an output. For example, it may be desirable to understand the effect of temperature and pressure on the strength of a glue bond.

DOE can also be used to confirm suspected input/output relationships and to develop a predictive equation suitable for performing what-if analysis.

DOE Procedure
Acquire a full understanding of the inputs and outputs being investigated. A process flow diagram or process map can be helpful. Utilize subject matter experts as necessary.

Determine the appropriate measure for the output. A variable measure is preferable. Attribute measures (pass/fail) should be avoided. Ensure the measurement system is stable and repeatable.

Create a design matrix for the factors being investigated. The design matrix will show all possible combinations of high and low levels for each input factor. These high and low levels can be generically coded as +1 and -1. For example, a 2 factor experiment will require 4 experimental runs:


Note: The required number of experimental runs can be calculated using the formula 2n where n is the number of factors.

For each input, determine the extreme but realistic high and low levels you wish to investigate. In some cases the extreme levels may be beyond what is currently in use. The extreme levels selected should be realistic, not absurd. For example:

Enter the factors and levels for the experiment into the design matrix. Perform each experiment and record the results. For example:


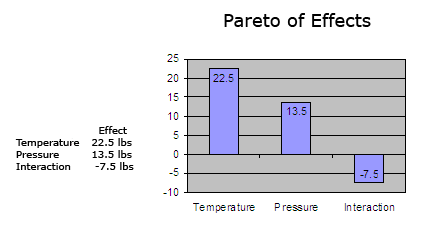
Calculate the effect of a factor by averaging the data collected at the low level and subtracting it from the average of the data collected at the high level. For example:

Effect of Temperature on strength: 
(51 + 57)/2 - (21 + 42)/2 = 22.5 lbs

Effect of Pressure on strength:
(42 + 57)/2 - (21 + 51)/2 = 13.5 lbs

The interaction between two factors can be calculated in the same fashion. First, the design matrix must be amended to show the high and low levels of the interaction. The levels are calculated by multiplying the coded levels for the input factors acting in the interaction. For example:


Calculate the effect of the interaction as before.

Effect of the interaction on strength:
(21 + 57)/2 - (42 + 51)/2 = -7.5 lbs

The experimental data can be plotted in a 3D Bar Chart.
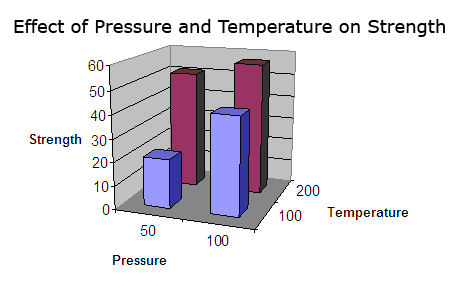


This simple-minded example above shows that there is an interaction between temperature and pressure in the strength of the glue bond. This is one feature of DOEs that is particularly useful when looking at the effect of a number of factors and their effect on the critical functional response.

Now that that is out of the way as intro, let's look at the specific experiment I had in mind in the next post.

The experiment I was trying to reproduce was the one based on the graph  from research based on the Harman Curve showing that listeners perceived a room as having flat room reponse when the measured frequency actually looked more like this. This is because our hearing is not linear at lower frequencies:
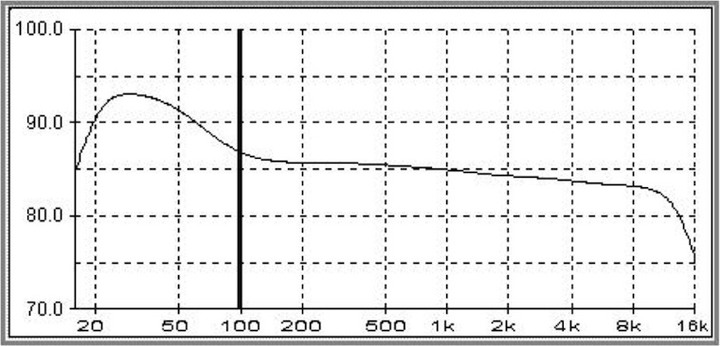


Given this, I set out to to perform a set of experiment to see if I could determine the optimal settings of speakers, REL sub settings and other factors, like grilles on or off, speaker toe-in, port plugs, etc. that would optimize the in-room response.

With that in mind, I set out to see what I could do with my set up to emulate that via DOE.

System used at the time was: Conrad-Johnson Premier 17LS Preamp, Conrad-Johnson LP70S, Dynaudio Contour S3.4 speakers, REL R-305, M-Audio MobilePre USB mike preamp, Dayton calibrated measurement microphone with calibration file, and Room EQ Wizard Software. The Room EQ Wizard software generates and simultaneously measures the frequency sweep from 10 Hz to 20,000 Hz.

The desired responses were to maximize 20 and 50 Hz repsonse in dB, and minimize the 150 and 500 Hz responses. These 150 and 500 Hz responses were nodes that I wanted to minimize, if possible.

An example trace as my starting point for reference is shown. The following are the real-time, IN-ROOM measured responses from the listening position for the right channel speaker. NOTE The the brown trace is in the actual, measured, in-room response for the R channel with the sub out of the system, and purple trace is where I started with the sub in in the system, before optimizing things using the DOE approach (see next post, below). The following are the real-time, in-room measured responses from the listening position for the right channel* speaker (*-I also measured the L channel separately; data not shown for brevity). I should also add there were no acoustical panels or acoustical treatments in my room at the time, BTW, so please bear that in mind.
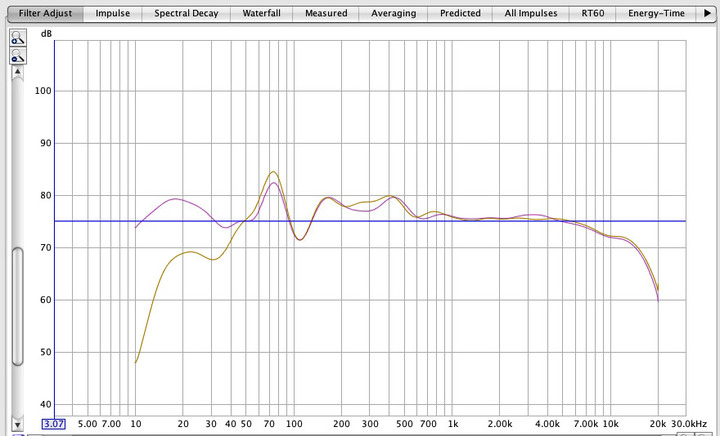


The goal here was to maximize the 20-50Hz node to range, while smoothing the 70 Hz, and minimizing the 105, 155 and 500 Hz node peaks, so as to emulate as closely as possible the Harman Curve.

The factors I used for the DOE were sub gain (as clicks up from zero), sub crossover, likewise clicks up from zero, plug or no plug in the speaker reflex port. So, four responses being measured as the result of 3 factors at two different levels (low, high as in the examples above shown).

Setting up a full-factorial DOE in JMP (a stastical package), here are the experimental matrix I ran per JMP's output for the experimental design and the ACTUAL measurements for each frequency (as measured in dB by room Eq Wizard).


The next post will be the analysis of the data...
« Last Edit: 30 Jan 2025, 06:54 am by Stephen Scharf »

PumaCat

  • Jr. Member
  • Posts: 190
Here is the result of analyzing the 20 Hz response of the DOE.


We can see from the actual by predicted plot that the R^2 and r^2 adjusted are strongly correlated at 0.97 and 0.94, respectively, indicating that our results fit our model quite well. Also the leverage plots (the factors affecting the response (20Hz output), show that Sub gain has a large effect, and quite possibly that the interaction of sub gain and sub crossover may have an effect, as the p-value is just barely above p>-.05, which tends to suggest there may be a significant effect if we gather more data or relax our confidence level from 95% to 90%. In, fact, if we relax our alpha from 5% (the chance we are willing to accept that we are wrong) to 10%, then the Sub crossover point becomes significant. In addition, our analysis of variance with probability of F >0.0016, suggests that that this result occurred from our null hypothesis, that the model does not predict sub 20 Hz performance is very low.

The interaction profile plots also suggest that there is a likely interaction between Sub XO setting and Sub gain, and the plot lines are not perfectly parallel, but appear to intersect.

Looking at the Prediction Profiler from JMP, comparing Sub gain with Sub XO, we can see that the maximum 20 Hz response is obtained by the Sub gain at 12 clicks up, and sub set at zero clicks, and we could expect a level of 75.1875 dB.


JMP is also cool because it will show you a 3-D image of two factors at one time as they affect the desired response in a 3-D cube, in this case, the 20 Hz response. As you can see, the  upper left corner of the rectangle shows, which is max 20 Hz response is at a sub crossover of zero, and a gain setting of 12.


These analyses show how you can utitlize DOE to predict with good confidence the response from setting the factors (crossover point and gain) to give the desired response at 20 Hz.

I used this approach then to measure the BEFORE and AFTER responses, in this graph, BEFORE is BLUE  (the brown trace in the first post above) and AFTER is GREEN for R channel speaker* with the subwoofer in the system and set to the subwoofer GAIN and XO settings based on where the DOE analysis tells me where to "set the knobs", aka, the control factors, GAIN and Crossover.  Note how much smoother the overall frequency response is for the green trace. (*-Also performed the same DOE analysis for the L channel and obtained statistically-comparable results).


Conclusions: Is this an "absolutely perfect" in-room frequency response? No, as I mentioned above, this experiment was done with virtually no acoustical panels or acoustical treatments in my room at the time. The point of doing this DOE was to demonstrate how one can use powerful statistical analysis and tools, e.g. JMP, to understand with statistical rigor and insight how to effectively integrate a sub into your system, or in another context, improve the overally system's in-room frequency response. Moreover, it does get pretty darned close to the Harman Curve, which was the objective and overall design parameter for this experiment.

Danny, if I ever get out to your neck of the woods in Texas, be happy to show you and your team how to use JMP and DOEs for your loudspeaker design and development if you'd be interested.

Hope you guys find these posts educational, informative and interesting.

Cheers, gents.
« Last Edit: 30 Jan 2025, 06:56 am by Stephen Scharf »

PumaCat

  • Jr. Member
  • Posts: 190
No one has any thoughts on the DOE?  :wink:

Given how much the gang here likes "measurements", I thought you'd guys would be all over this.

Interesting...

WGH

No one has any thoughts on the DOE?

Beside all the calculations being over my head, in my setup measurements are not necessary. I have only one location for the sub so that variable is fixed.
The sub has a remote control with digital readout calibrated in dBs so the sub's low pass filter is set to 34 Hz, about where my main speakers naturally start to roll off.
Level is set to 22, just where the sub disappears on most recordings. Some modern albums have boosted bass so the level is lowered. Some early cool jazz recordings has less bass so the level is raised.
The digital readout eliminates all guesswork returning back to the 22 setting.

Measurements made with Radio Shack 33-2050 analog meter with the Stereophile Test CD #1 warble test tones. The SPL correction table for the RS meter was used.

1 KHz - 75dB calibration tone
200 Hz - 80 dB
160 Hz - 82 dB
125 Hz - 81 dB
100 Hz - 81.1 dB
80 Hz - 75.1 dB
63 Hz - 80.3 dB
50 Hz - 82.3 dB
40 Hz - 95 dB
31.5 Hz - 93.6 dB
25 Hz - 89.9 dB
20 Hz - 81.8 dB
15 Hz - Yup, still there, no measurement but probably 74 dB

PumaCat

  • Jr. Member
  • Posts: 190
Beside all the calculations being over my head, in my setup measurements are not necessary. I have only one location for the sub so that variable is fixed.
The sub has a remote control with digital readout calibrated in dBs so the sub's low pass filter is set to 34 Hz, about where my main speakers naturally start to roll off.
Level is set to 22, just where the sub disappears on most recordings. Some modern albums have boosted bass so the level is lowered. Some early cool jazz recordings has less bass so the level is raised.
The digital readout eliminates all guesswork returning back to the 22 setting.

Yes, understand your setup practice and it's consistent with general recommendations that REL makes, as well.

The reason I posted the DOE and it's analysis is that a number of folks here do measurements (as do Danny and Ron) of their speakers and subs using a software application (e.g. REW, as one example), and the benefit of performing the DOE analysis is it will tell you exactly where to set the sub output controls (i.e., "the knobs", Gain & Crossover) to obtain the desired in-room response, and it will do so with statistical rigor, assuming you have a good model with good R-Square, R-Square Adjusted and p-values. This take a lot of the guesswork and trial & error out of the setup process.

Such is the power of quality data and the appropriate statistical analysis of said data. I'll just close by saying that conducting the proper and effective statistical analysis of one's data is how scientists and engineers (well, good ones, anyway 8)) go about their daily work in the "real world." I certainly did in my day job working as a PhD-level molecular biologist in Biotech my entire career, as did my fellow scientists.

Cheers and thanks for your reply.


Hafgrim

  • Jr. Member
  • Posts: 46
I've always just eyeballed it and took napkin notes. I'll try this the next time I make a change to my setup. I wish rew would let me organize all the measuments better. I can easily end up with near 100 measumentw when I try out new stuff in my listening room.

WGH

What do you guys do when your carefully calibrated setup plays the new and wonderful album by Mary Chapin Carpenter, Julie Fowlis, and Karine Polwart, ‘Looking for the Thread’ ?


In my system the album has a big, overwhelming bass boost around 31.5 - 40 Hz, right where I have the most room gain. I have to lower my REL's low pass filter to 24 Hz and the level to 5 dB. I could actually turn off the sub because the album doesn't have any significant low, low bass.

Do you take a photo of your dial settings for reference and then twist away to lower the boost? Or live with it?

PumaCat

  • Jr. Member
  • Posts: 190
<SNIP>
 I wish rew would let me organize all the measurements better. I can easily end up with near 100 measurements when I try out new stuff in my listening room.

Yep, I get that.

Cheers.

PumaCat

  • Jr. Member
  • Posts: 190
What do you guys do when your carefully calibrated setup plays the new and wonderful album by Mary Chapin Carpenter, Julie Fowlis, and Karine Polwart, ‘Looking for the Thread’ ?
<SNIP>
Do you take a photo of your dial settings for reference and then twist away to lower the boost? Or live with it?

The DOE analysis (specifically the Leverage plot above for Gain) told me that for my room, the Gain knob is the only control that drives LF response by the sub in the room for the 2-channel setup, so I have the Crossover setting at 0. 

Once I got the settings on the REL determined from analyzing the DOE, I haven't changed them.

In engineering and product development, it's best to keep things as simple as possible. If a functional response, feature, or quality attribute (e.g., reliability, durability, serviceability, repairability, etc.) for a product is required, provide it in the simplest manner possible. Simple is good because, quite simply (pun intended ;)) there's less things...that can go wrong.  :thumb:

Just to extend that thought, Nelson "Papa" Pass has told us for many years, that when it comes to stereo amplifier design, "The simplest circuits sound the best". Papa's right.

I'm sure Danny has also learned that with respect to designing and implementing crossover circuits for a specific loudspeaker, that the simplest crossover circuits that "get the job done" (with respect to frequency response, ringing, spectral decay, crossover points, etc.) sound the best, as well.

I don't listen to that album, so it's not a problem, but to answer your question specifically, if I encountered the situation you did, I'd just lower the Gain setting on the REL, or just turn the REL off.


Cheers.
« Last Edit: 3 Feb 2025, 08:55 pm by Stephen Scharf »

Letitroll98

  • Volunteer
  • Posts: 5752
  • Too loud is just right
What do you guys do when your carefully calibrated setup plays the new and wonderful album by Mary Chapin Carpenter, Julie Fowlis, and Karine Polwart, ‘Looking for the Thread’ ?

Sorry for the off topic, but loaded up this album this morning and it's absolutely lovely.  Thanks for the recommendation .

PumaCat

  • Jr. Member
  • Posts: 190
Sorry for the off topic, but loaded up this album this morning and it's absolutely lovely.  Thanks for the recommendation .

 :thumb: