Yes, that would be an interesting discussion. Ever notice how some manufactures broadly state the FR without mentioning how varied the response is? Or exaggerate the sensitivity, etc?
Objective Measurement is a
explosive topic since most speakers manufacturers do mathematical medianization of the freq resp graph, resulting that the graph showing the public is false as its not faithful to the speaker.
By the little I know and have seen so far the only
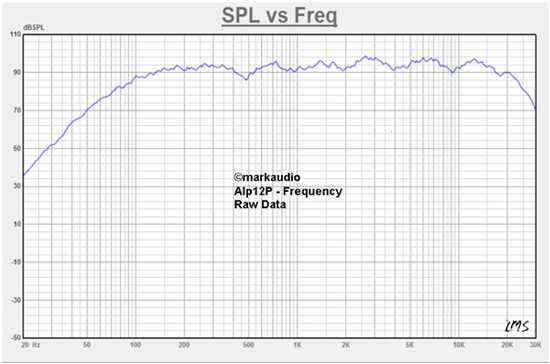
true freq resp chart showed
as such is the Alpair 12P where they mention it is
''raw data'' ie the actual data of the driver, the data were not manipulated and mediated to decrease the treble and increase the bass.