Thanks again for your assistance.
I see your joke here.
I'm glad.

Only half a joke though... I haven't tried further with this, but I
do have some other measurements, below.
I don't see how you got to input impedance of 600 Ohms...
From my understanding of op-amps and its circuit, the "LNMP" I build
should have an input impedance equal to the first resistor. In my
case, I used 600ohms there. For any of my high voltage measurements,
I'm using C409 and R435 in the chime connected by a jumper to an
insulated probe. I'm not able to say what the resulting load would
be.
(For all measurements of the external trial board, I always measure at
the output, and haven't changed its schematic.)
I continue to second-guess my measurements, since they strike me as
incredibly unlikely. To help, I've now got a good (USB Audigy) sound
card for performing FFT in the audio band. This does reveal that
there is actually a substantial difference in the spectrum of the
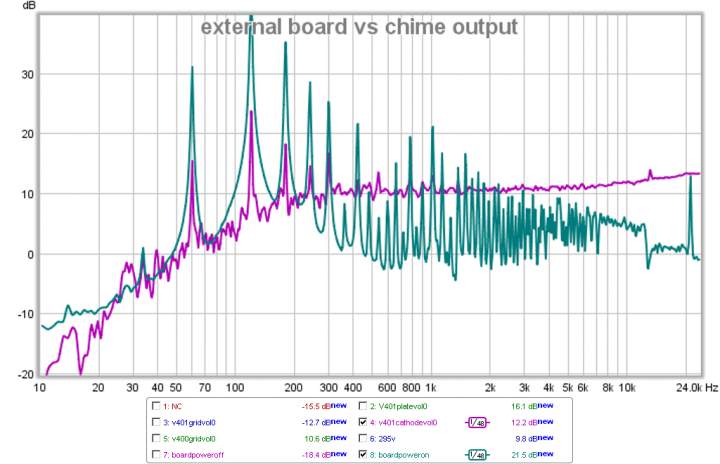
external board. The following is a comparison of using the same half
of the Telefunken 12AU7 either in the chime, with all normal
connections (fushia), or in my external test board (green).
This is measured at the output, and amplified by 40dB before input
into the computer. I'm not positive of the absolute value of dB on
the axis, though relative values are correct. For reference, the
fushia line measured about 75mV peak-peak on my oscilloscope.
Ignoring the increase in 60hz harmonics, there is a large difference
at higher frequencies. By ear, I still contend that these don't sound
very different.
This next plot has the same fushia line in addition to the following,
described bottom to top at the 10khz position:
* NC: No connection. This is my 3 inch jumper floating.
* v401gridvol0: V401 grid. Volume control is at nil.
* V400gridvol0: V400 grid. Volume control is at nil.
* 295V: 295V rail, at the top of R429.
* V401platevol0: V401 plate. Volume control is at nil.
* V401cathodevol0: Normal output connectivity. Volume control is at nil.
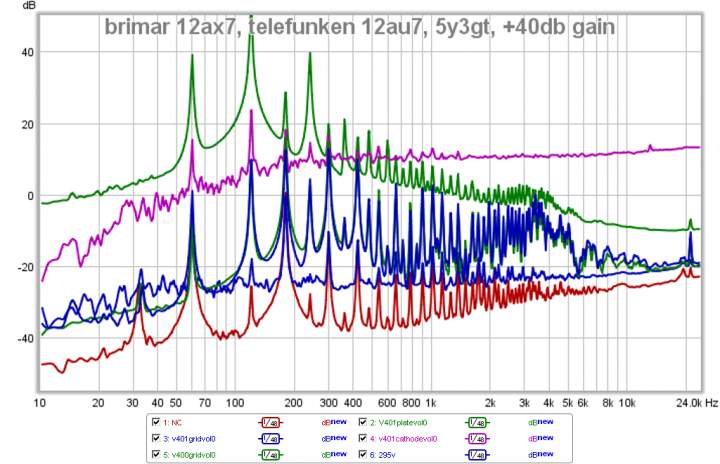
There does seem to be some volume dependence of the noise. At nil or
full volume, 60hz harmonics are more audible. They are reduced at 50%
volume. The noise sounds lower at 100% volume, though I can't
rationalize this with the following plot.
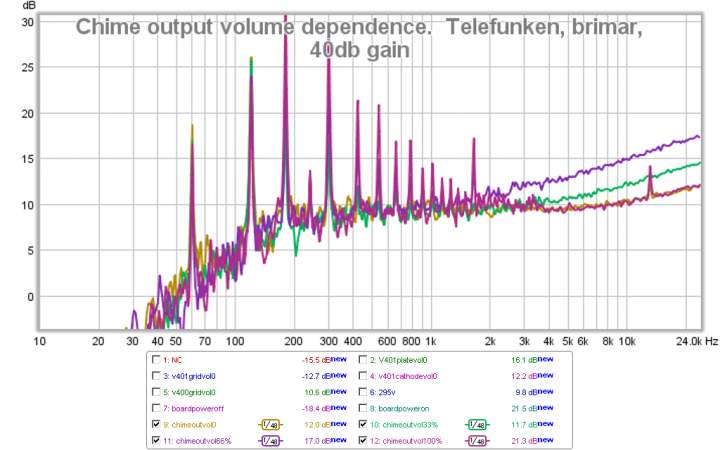
Here, from bottom to top at the 10khz position:
* chimeoutvol100% (red): Volume at 100%. Note that this is identical
to 0% at high frequencies. To ear, the 60hz harmonics sound louder
than 0%, despite what this plot indicates. The noise sounds lower.
* chimeoutvol0 (golden): Volume at 0%. This is identical to the
fushia line I described above.
* chomeoutvol33%: Volume at approx. 33%. The noise does sound louder.
* chimeoutvol66%: Volume at approx. 66%. This is the maximum loudness
of the noise that I can achieve.
This plot was made with a complete Chime. I did try removing the
HagDAC. It didn't make any difference in the measurements.
Incidentally, these plots seem to be reduced in quality once I upload
them to the forum. The originals are at
http://jjoseph.org/photos/projects/hagerman_chime/.
Thanks again.
~Jacob