....and especially, I would like to know how precisely the LDRs end up matching at different levels: this is especially important for balanced circuits.
On this question, which I agree is highly germane, we have abundant data.
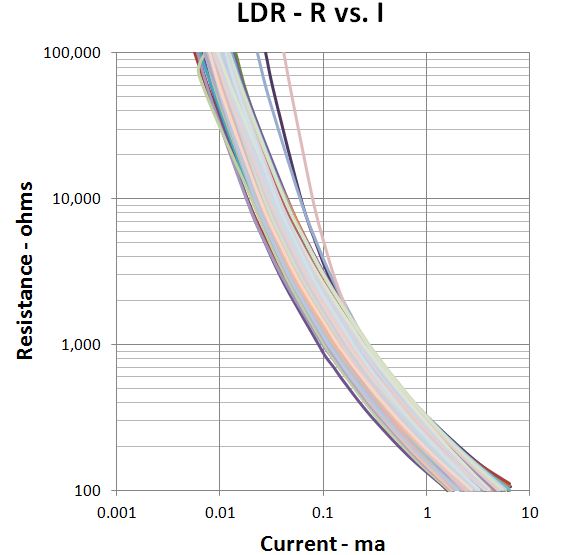
Let's start with the performance of individual LDRs of the same make and model. The pic below shows the results of plotting R-resistance vs. I-current for approximately 150 LDRs between 100 and 100k ohms. The first pic shows this relationship with R plotted logarithmically.
The first thing you notice is there's considerable variability from one LDR to the next. This is challenge #1 with LDRs. Getting 2 or more that match.
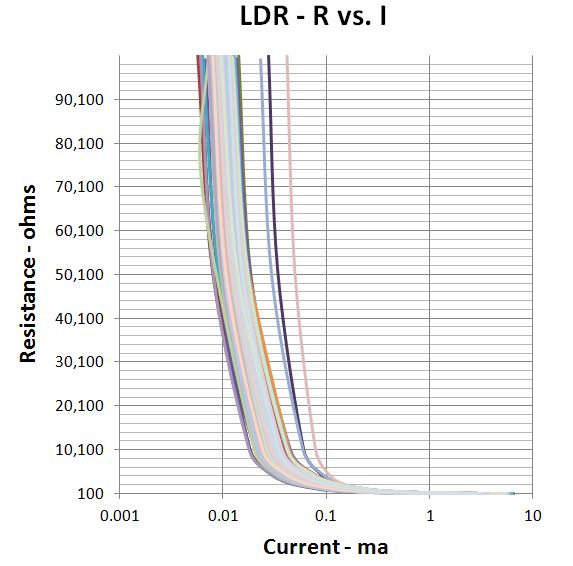
To drive home the second challenge with LDRs, the pic below shows this same data but now the R is plotted linearly with I. The nonlinearity becomes very pronounced much below 10k ohms.
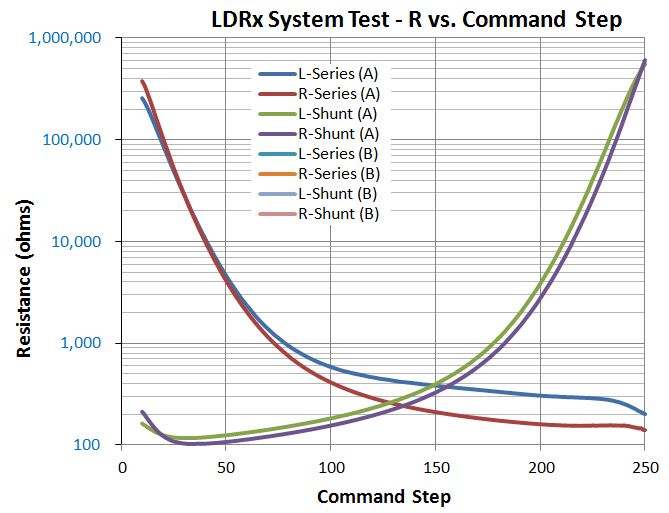
So let's say we grab 4 of these LDRs that are most similar, put them into an LDRx preamp board. 2 LDRs are used in each stereo channel. One is in series with the audio signal and the second shunts the audio signal to ground. The output signal is taken between the series and the shunt. We run the whole board assembly through almost its maximum volume range which corresponds to internal IC/CPU steps from 0-255. I'm not going to go into any more detail on all that since its proprietary. But the results of this system test (measured data) are shown below for an assembled LDRx board with 4 matching LDRs.
Matching yes, kind of, but even so this is hardly evidence of perfectly matched LDRs. No doubt we could have tested another 50-100 individual LDRs and arrived at a more precisely matched set of four. But lets move on.
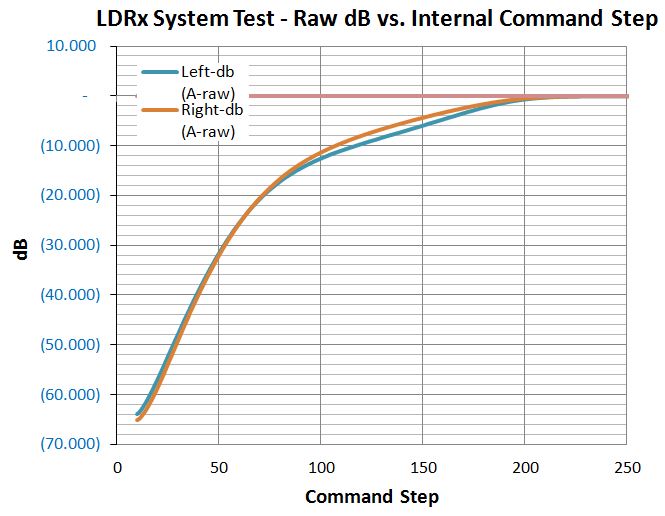
Now let's see what these series-shunt pairs of LDRs look like in terms of their attenuation characteristics. This next pic shows the resulting raw attenuation curve before we do any correcting or distill this down into the final volume step vs. dB audio taper. Not too bad really. But we can do better.
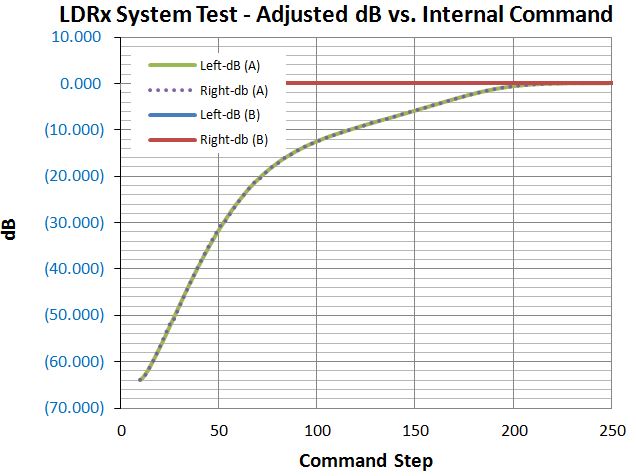
Next we apply a correction algorithm where we move the test results around to better match left and right channel attenuation. The resulting attenuation curves are now in lockstep over the full attenuation range (within fractions of a dB). Now we're rock'n! Please note that this isn't just some visual gimmickry. We actually shifted the selected data points of one channel up or down a few steps so that it matched the other channel.
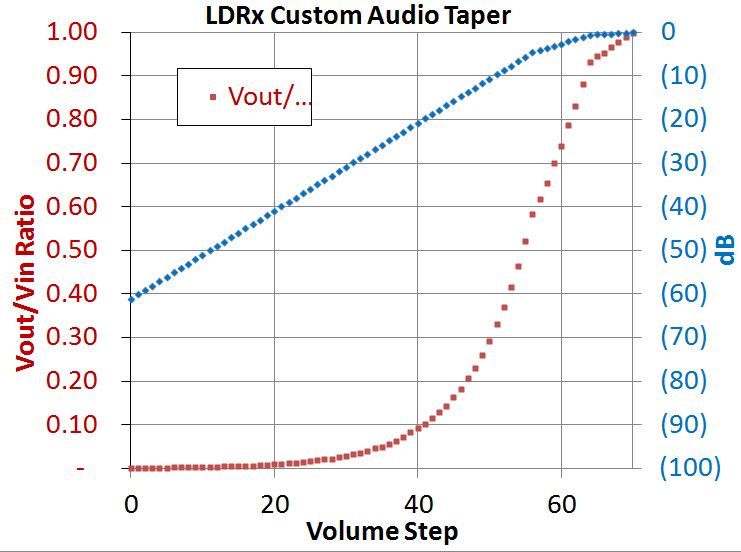
Lastly, we take the above corrected attenuation data and convert it into the 70 volume steps programmed into the final software. The 70 steps cover ~60dB. Notice we bend the audio taper over the last few dB. This helps to lessen the tendency to come on too strong with big sound pressure steps as the volume gets close to max (0 dB attenuation) level.
The result is each LDRx passive preamp has its own custom corrected attenuation curve based on the performance test results of how the matched LDRs actually perform when installed in each build.
We use the same methodology to arrive at perfectly matched attenuation curves using 8 LDRs in a balanced preamp configuration. Without a software based design, this approach, and the positive audible results, would be impracticable if not impossible.