I don't understand spectral decay

0 Members and 1 Guest are viewing this topic. Read 1548 times.

johnwoitalla

  • Jr. Member
  • Posts: 37
I don't understand spectral decay
« on: 30 Jan 2025, 06:51 pm »
I am a huge fan of science, but physics-by far, is my weakest subject...to the point of being virtually illiterate. With that being said, would some of you with a better edumacation and understanding in the subject please explain "spectral decay" to me (like I'm an 8th grader). I look at the graphs that Danny puts up on his videos, and as far as I'm concerned, he might as well be explaining quantum mechanics to a kindergardener.

newzooreview

Re: I don't understand spectral decay
« Reply #1 on: 30 Jan 2025, 07:35 pm »
Spectral decay, in the context of audio equipment like speakers or headphones, is a way to measure how quickly sound stops after the music or signal ends. Imagine hitting a bell: it rings loudly at first, then the sound fades over time. Spectral decay graphs show how different pitches (frequencies) fade away, like watching the bell’s ring disappear for each note.

When a speaker plays a sound, it doesn’t stop instantly—it vibrates slightly afterward. A spectral decay graph (often called a CSD plot) shows how long these vibrations last across different pitches. Think of it like ripples in water after you throw a stone: the graph tracks how fast the ripples calm down.

Vertical axis: Loudness (in decibels).
Horizontal axis: Pitch (frequency, like bass or treble).
Front to back axis: Time (how long each pitch lingers, usually in milliseconds).

A "clean" graph drops quickly from back to front, meaning the speaker stops vibrating quickly when the signal ends. If you see peaks or lines that stay high, those pitches are resonating too long, like a bell that won’t stop ringing.

Speakers with poor spectral decay can sound muddy or echoey because certain notes overstay their welcome. For example, if a bass note lingers, it might clash with the next note in a song.

If you’ve ever tapped a wineglass and heard it ring, that’s resonance. A good speaker minimizes this effect, stopping vibrations almost instantly. A spectral decay graph helps engineers spot which frequencies are “ringing” too long, so they can fix it.

In the videos, these graphs help compare speakers: flat, fast-decaying lines = good; lingering peaks = potential issues.

johnwoitalla

  • Jr. Member
  • Posts: 37
Re: I don't understand spectral decay
« Reply #2 on: 30 Jan 2025, 07:49 pm »
Spectral decay, in the context of audio equipment like speakers or headphones, is a way to measure how quickly sound stops after the music or signal ends. Imagine hitting a bell: it rings loudly at first, then the sound fades over time. Spectral decay graphs show how different pitches (frequencies) fade away, like watching the bell’s ring disappear for each note.

When a speaker plays a sound, it doesn’t stop instantly—it vibrates slightly afterward. A spectral decay graph (often called a CSD plot) shows how long these vibrations last across different pitches. Think of it like ripples in water after you throw a stone: the graph tracks how fast the ripples calm down.

Vertical axis: Loudness (in decibels).
Horizontal axis: Pitch (frequency, like bass or treble).
Front to back axis: Time (how long each pitch lingers, usually in milliseconds).

A "clean" graph drops quickly from back to front, meaning the speaker stops vibrating quickly when the signal ends. If you see peaks or lines that stay high, those pitches are resonating too long, like a bell that won’t stop ringing.

Speakers with poor spectral decay can sound muddy or echoey because certain notes overstay their welcome. For example, if a bass note lingers, it might clash with the next note in a song.

If you’ve ever tapped a wineglass and heard it ring, that’s resonance. A good speaker minimizes this effect, stopping vibrations almost instantly. A spectral decay graph helps engineers spot which frequencies are “ringing” too long, so they can fix it.

In the videos, these graphs help compare speakers: flat, fast-decaying lines = good; lingering peaks = potential issues.

Thank you for that explanation- it is a good start for what I'm trying to accomplish with this post, but now I must learn how to interpret the spectral decay graphs on Danny's videos. And for that, I guess examples with explanations are needed. Can you please point me in the right direction with some links, etc? What does an optimum (or gold standard graph look like) as compared to others that deviate from that standard?

Early B.

Re: I don't understand spectral decay
« Reply #3 on: 30 Jan 2025, 08:40 pm »
What does an optimum (or gold standard graph look like) as compared to others that deviate from that standard?

This question was answered: A "clean" graph drops quickly from back to front, meaning the speaker stops vibrating quickly when the signal ends. If you see peaks or lines that stay high, those pitches are resonating too long, like a bell that won’t stop ringing. 

In other words, an optimum spectral decay graph is one where there won't be any significant "humps" above 1K. This is an example of a clean spectral decay after Danny "fixed" a Klipsch crossover:


newzooreview

Re: I don't understand spectral decay
« Reply #4 on: 30 Jan 2025, 08:50 pm »
GR Research video comparing and explaining 18 speakers’ spectral decays:
https://www.youtube.com/watch?v=tPDXy78auBA

Cumulative Spectral Decay explanation with examples:
http://theaudioannex.com/forum/threads/how-to-read-a-speakers-cumulative-spectral-decay-plot.9439/

CSD plot analysis of M-Audio BX5 and Vifa tweeter:
https://audiojudgement.com/cumulative-spectral-decay-csd-plot/

Interpreting CSD/waterfall plots:
https://diyaudioheaven.wordpress.com/tutorials/how-to-interpret-graphs/csdwaterfall-spectrum/

Forum discussion on decay lines and spectral content:
https://www.audiosciencereview.com/forum/index.php

REW’s waterfall graph guide:
https://www.roomeqwizard.com/help/help_en-GB/html/graph_waterfall.html

Hobbsmeerkat

  • Industry Participant
  • Posts: 2728
Re: I don't understand spectral decay
« Reply #5 on: 30 Jan 2025, 09:57 pm »
This question was answered: A "clean" graph drops quickly from back to front, meaning the speaker stops vibrating quickly when the signal ends. If you see peaks or lines that stay high, those pitches are resonating too long, like a bell that won’t stop ringing. 

In other words, an optimum spectral decay graph is one where there won't be any significant "humps" above 1K. This is an example of a clean spectral decay after Danny "fixed" a Klipsch crossover:

??? 
That is definitely the Before of the Klipsch RP 8000F, that massive hole at the crossover point, which is partially a phase issue with the drivers being ~100 degrees out of phase (they only slightly cancel at the crossover point)

This is the After for the 8000F


it's mostly clean, except for a smaller hump near the bottom around 600-1200Hz, which is most likely the back wave within the speaker re-exciting the woofer.

Early B.

Re: I don't understand spectral decay
« Reply #6 on: 30 Jan 2025, 10:00 pm »
That is definitely the Before of the Klipsch RP 8000F,

Ooops. I posted the wrong graph!

Hobbsmeerkat

  • Industry Participant
  • Posts: 2728
Re: I don't understand spectral decay
« Reply #7 on: 30 Jan 2025, 10:48 pm »
Here is a great example of "ringing" or "stored energy" this example being the Dynaudio Special 40


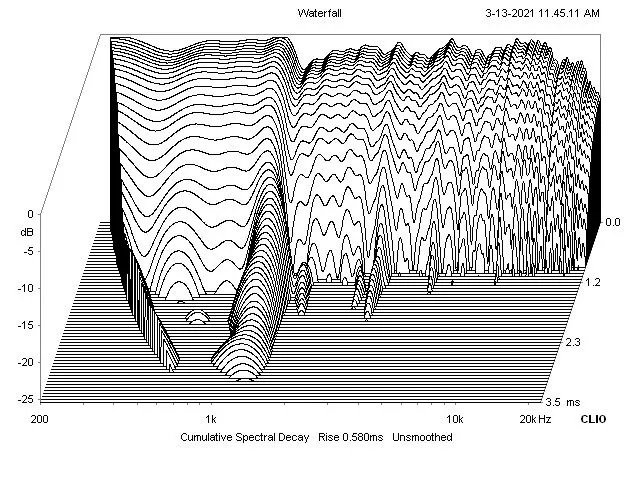
That big, long trail around 1Khz is a resonance within the woofer, either from the cone itself, or the surround.

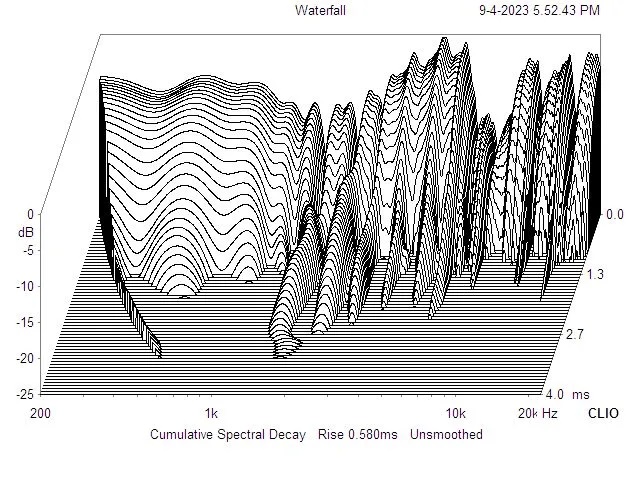
Here's a combination of phase issues, ringing and breakup happening all at once (Pioneer HPM100) where the mid driver is really stiff and full of resonances (the peaks &ridges that maintain their) output), and is allowed to play overtop the tweeter, creating all sorts of issues.


In the Monolith speakers, you can really see the delay in roll-off that heavy woofers can cause especially compared to how fast the dome tweeter and mid drivers are:


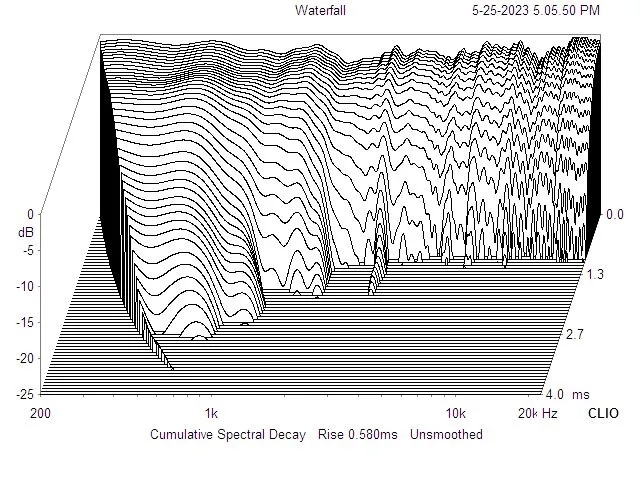
The left hand side of the graph sticks forward quite a bit further than the middle or treble frequencies as you look to the right side, which is an indication of fairly heavy moving mass, meaning the woofer isn't able to stop quite as quickly, but thankfully don't show any signs of ringing. But this can tell you how the midrange is going to sound, as it's a bit "sluggish" so the midrange might sound a little "heavy," lacking in speed, clarity or "texture".
(Similar things can be seen in 2-way speakers where a tweeter is paired with large woofers)

For comparison, here is the "Bully" with our T26 and a pair of M130s.


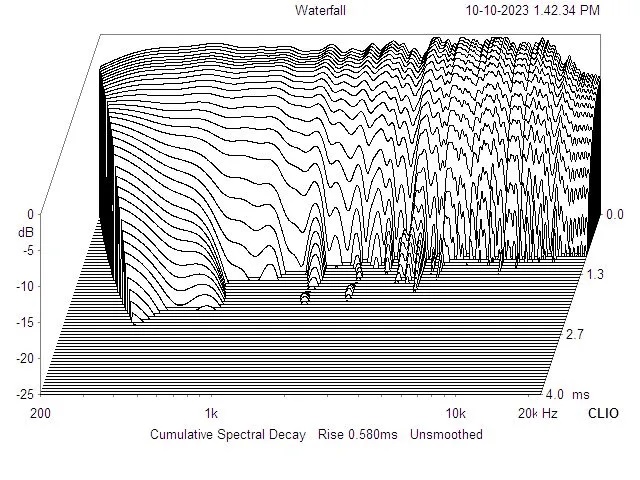
The M130s are a light weight woofer, so they stop faster than the heavier Monolith woofers.
The tiny little fingers that only show up at the bottom around 3-5KHz are indicative of small surface reflections, in this case, likely off the edges of the woofers on either side of the tweeter.
(Similar things can be seen in 2-way speakers with large woofers)

johnwoitalla

  • Jr. Member
  • Posts: 37
Re: I don't understand spectral decay
« Reply #8 on: 31 Jan 2025, 01:49 am »
I feel like I'm beginning to understand the spectral decay waterfall graph a little better, thank you all for helping. I'm going to try to explain my own personal understanding so that I can be corrected where I am wrong or need further teaching. Be patient with me as I'm at the bottom of the learning curve here.
I see three axis- X, Y, and Z. The X axis is the frequency, the volume of the wave is the Y axis, and how long the driver produces a sound wave is the Z axis. It appears to me that if a driver produces a sound wave at a particular frequency longer than about 1.2ms, then an issue with ringing can be observed. I see that on the left side of the graph where bass notes are produced, they tend to last slightly longer than the high frequencies and (I'm assuming) that that is a phenomenon associated with the mass of the woofer(the greater the mass, the more difficult it is to both initiate and cancel movement of the driver). I'm guessing that with woofers, a longer decay rate  equates to a boomier bass. I am also guessing that with higher frequencies, longer decay rates may cause listener fatique and harshness. Does my understanding seem to be in the ball park?
« Last Edit: 1 Feb 2025, 02:18 am by johnwoitalla »

Digi-G

Re: I don't understand spectral decay
« Reply #9 on: 31 Jan 2025, 01:22 pm »
One other thing may may or may not be obvious (I'm sure someone will tell me if I'm mistaken here) is the line at the very top of the graph, going left to right is the frequency response of the speaker.  Compare the shape of that line to the FR curve that Danny shows and you'll see they are the same.

Danny Richie

Re: I don't understand spectral decay
« Reply #10 on: 31 Jan 2025, 07:31 pm »
I'm guessing that with woofers, longer a decay rate  equates to a boomier bass. I am also guessing that with higher frequencies, longer decay rates may cause listener fatique and harshness. Does my understanding seem to be in the ball park?

You are getting it.

Danny Richie

Re: I don't understand spectral decay
« Reply #11 on: 31 Jan 2025, 07:33 pm »
One other thing may may or may not be obvious (I'm sure someone will tell me if I'm mistaken here) is the line at the very top of the graph, going left to right is the frequency response of the speaker.  Compare the shape of that line to the FR curve that Danny shows and you'll see they are the same.

That's true.

When looking at frequency response I use 1/3rd octave smoothing as I am looking at a more average level.

In the spectral decay there is no smoothing applied as I am looking for the decay rate of each and every little bump for stored energy.

FireGuy

Re: I don't understand spectral decay
« Reply #12 on: 31 Jan 2025, 11:14 pm »
Now this thread has been a good read.  Thanks to all.  Esp the OP.

johnwoitalla

  • Jr. Member
  • Posts: 37
Re: I don't understand spectral decay
« Reply #13 on: 1 Feb 2025, 02:29 am »
When it comes to bass then, considering that woofers by their nature must have (what seems to me anyhow) exponentially more massive driver cones, what are the work arounds? How fast do the best sub woofers start and stop? Is the decay rate issue the reason open baffles are a better choice for bass units? What about horns, can a decent woofer be made with a horn and if yes, what do the decay rates look like for them?

S Clark

  • Full Member
  • Posts: 7464
  • a riot is the language of the unheard- Dr. King
Re: I don't understand spectral decay
« Reply #14 on: 1 Feb 2025, 02:35 am »
Here is one solution.

Lots of smaller drivers with very little individual excursion... the LS9 line source.  The other good option are servo controlled drivers. 

newzooreview

Re: I don't understand spectral decay
« Reply #15 on: 1 Feb 2025, 03:11 pm »
When it comes to bass then, considering that woofers by their nature must have (what seems to me anyhow) exponentially more massive driver cones, what are the work arounds?

Bass needs air displacement. Air displacement can be achieved via a big surface area moving a little bit or a small surface area moving a lot. Technology advances.

Historically it has been easier to control distortion with a larger cone moving a little bit.

We now have smaller Purifi drivers with novel surround geometries that can move a lot without the inherent distortion.

Ascend Acoustics has a 6" custom Seas bass driver that moves 2.2 cm. There are other examples.

Advances in materials, modeling (including AI), theory, and measurement approaches will continue to expand the options available.

But physics places a boundary on it: the volume of air needs to be moved to create the pressure wave, and that has to be done accurately.

jmimac351

  • Full Member
  • Posts: 645
  • Chief Instructor - ChinTrackDays.com
Re: I don't understand spectral decay
« Reply #16 on: 3 Feb 2025, 02:51 am »
When it comes to bass then, considering that woofers by their nature must have (what seems to me anyhow) exponentially more massive driver cones, what are the work arounds? How fast do the best sub woofers start and stop? Is the decay rate issue the reason open baffles are a better choice for bass units? What about horns, can a decent woofer be made with a horn and if yes, what do the decay rates look like for them?

For subs, the answer is easy - Servo Controlled Subwoofers.  The "Stop/Start" is exactly what they are targeting by the system FORCING the woofer to "STOP NOW!" vs being allowed to stop whenever the inherent design of the driver lets it. 

I have owned SVS best sealed subs and the servo subs I have are clearly superior, and they aren't even big.

For regular woofer, I'll give you an example - Scan-Speak 8545 vs GR M165NQ.

I have Merlin Music VSMs which use the Scan-Speak 8545.  Danny did a network for it, and it made a HUGE improvement to the speaker.  Then, I realized the bolt circles for the drivers are the same between the 8545 and M165NQ... so I swapped a M165NQ into the VSM.  The network for the M165NQ is so simple, and the crossover point was the same - so it worked great... even with Danny looking at it. 

Here's what happened when I swapped the M165NQ in for the Scan-Speak 8545... BIG increase in midrange clarity.  And when you look at the drivers, it makes sense.  The Scan-Speak is a "looser" driver.  It's also a heavier cone (harder to stop).  It has large excursion capability - the driver can move in and out a good distance.  So, it makes nice deep bass for a driver of its size.  It is really impressive. 

In contrast, the M165NQ is a "tighter" driver, less compliant.  The excursion is not as large, not as "easy", so it doesn't play as low.  But here's the thing... because it is a lighter cone and "tighter", by design, it is able to play higher frequencies better than the 8545.  That's why the midrange in the M165NQ is superior to the 8545, but it doesn't play as low as the 8545. Tradeoffs.

That is on purpose though... because Danny likes to use the proper tools for the job... don't ask a 6.5" woofer to play low bass, hand it off to subs.  Let the 6.5" woofers excel in midrange and punch and let the servo subs do what servo subs do. 

It's a system, and there are reasons why some drivers sound different from another, by design.