hey guys, great info here in the GIK site. thanks for everything!
Looking for a little guidance on my REW measurements in my room.
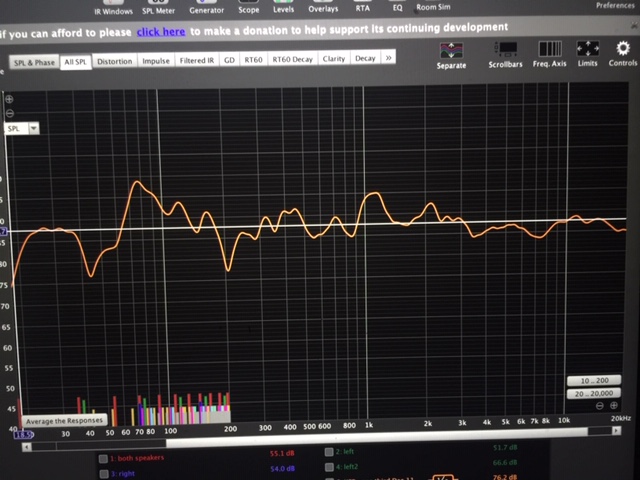
I have recently taken some frequency response measurements, and other than the bass region (which is a big deal, I know), I am fairly happy with the shape of the curve.
But, when i hit the waterfall graph option, my setting seem to be all messed up. The entire frequency range is pushed against the front....when I know only the bass region normally shows this. Can someone please offer some guidance on the waterfall graph settings?
I took a photo of the response, but failed to take a pic of the waterfall graph - and unfortunately, the saved file no longer opens (says it's not in the proper format).
Anyhow....I would certainly appreciate any experienced REW users' help along this journey!
Thanks! TJ