Thoughts on these graphs...

0 Members and 1 Guest are viewing this topic. Read 9742 times.

Chops

Thoughts on these graphs...
« on: 14 Feb 2022, 12:07 am »
Room is 21.8 ft long, 13.6 ft wide, and an 8 ft ceiling...

Spent the past five plus hours playing around with REW and my new Dayton Audio UMM-6 mic, attempting to dial in my system. I'll be the first to admit this room is in need of some major help.

The GR-Research X-Statik's create a huge peak at 74Hz. Keep in mind, these are sealed loudspeakers, and positioned 6' in front of the front wall and just over 3' from the side walls. Even when just by themselves, there's a huge hole that shows up between 35Hz to 50Hz! In any of the other rooms I've had these speakers in over the past 13 years, I've never seem huge peaks and dips like this before.

With the SVS PB-1000 Pro subs active, there's still a huge hole at 43Hz. Also, to help reduce that hole, I had to move the subs back towards the front wall. They are only about 1.5' away from the wall now, instead of the near 6' they were previously when positioned along side the mains. To get a smoother, cleaner transition from the subs to the mains, I had to cross the subs over at 72Hz with a 24dB slope, then dial them in with phase adjustments.

Whenever I get more time, I'll set everything up again and do some more measurements and tuning. It certainly doesn't look good on paper, but there is a vast improvement in overall sound quality over just the "throw them in and tune by ear" method I did when I got these subs. Which is also how I've been listening to them for the past couple months that I've owned them now.

Anyway, a few graphs to chat over...

Mains by themselves...


With subs...


The two above combined, and limited to 200Hz...


DannyBadorine

  • Full Member
  • Posts: 376
Re: Thoughts on these graphs...
« Reply #1 on: 14 Feb 2022, 01:30 am »
First, these graphs are not terrible. They are a result of the room.  The 74Hz bump is likely due to the 8ft. ceiling.  Have you tried it with the X Statiks and the subs closer together (either move the X-Statiks back or subs forward)?
That hole in 35-50Hz might be a phase issue with the subs.  Have you flipped the polarity on the subs?  I think they're too far from the X-Statiks.
I think a thick rug and some other sound treatment would give you some good results. 
Also, where exactly is your measurement microphone?

Chops

Re: Thoughts on these graphs...
« Reply #2 on: 14 Feb 2022, 01:57 am »
I've moved the mains 2 ft in all directions, and where they are now is where that peak dropped a max of half a dB. According to AMcoustics' room gain calculator, that 74 Hz peak is due to gain at the front and rear walls at the floor and ceiling, if I'm reading that correctly.

The subs were moved from right along side the mains, to a foot in front of them, to 4 and a half feet behind them (where they are now), as well as inward up to 5 ft from the side walls towards the center of the room, and done in 6" increments.

The hole at 43 Hz was nearly non-existent with the subs anywhere else other than where they are now. In fact, the ONLY area of the room where I heard that 43 Hz was right between the speakers and close to the front wall. Just a couple inches in front of the mains and it was totally gone. Totally bizarre.

Polarity, phase, crossover point, etc, etc all adjusted in most all locations tried. The mic was placed in the listening seat at ear level, and system set to 75-76 dB via pink noise.

System started out like this...


DannyBadorine

  • Full Member
  • Posts: 376
Re: Thoughts on these graphs...
« Reply #3 on: 14 Feb 2022, 02:32 am »
OK.  Damn.  OK.  Have you tried moving the listening position slightly?  Instead of moving the speakers, try moving the mic around to see how drastically it changes.  Sometimes it's helpful to listen in a spot that isn't in the middle of the room.  You have a tough situation with this room, but I still think sound treatment could help. 
Can you take a graph with subs and without subs so I can see that?  If they are overlayed then it's easier to see if they are summing correctly.

Chops

Re: Thoughts on these graphs...
« Reply #4 on: 14 Feb 2022, 02:43 am »
Yup, moved the mic around a bit as well. It didn't really make any difference at all with that peak. Also, that last chart above with the green and teal graphs are up to 200 Hz, with and without the subs. They're definitely summed correctly and clearly, the subs didn't change a thing to that 74 Hz peak, though they added energy from 85 - 135 Hz.

Note: In this particular measurement, I had the subs crossed at 98 Hz @ 24 dB slope. They're currently at 72 Hz.

DannyBadorine

  • Full Member
  • Posts: 376
Re: Thoughts on these graphs...
« Reply #5 on: 14 Feb 2022, 03:27 am »
OK.  I see that graph now.  I think the big hole in the low end is inevitable in that room.  It's just a product of the dimensions.  The only other thing I can think of trying is turning the subs 90 degrees and see what happens.  It's possible that it might level some things out, but probably not. You really just have a tough room.  DSP could help, but even then you will still have some problems. 

Maybe cross the subs around 60Hz, then try to mix them in below the X-Statiks so they don't add as much to the 74Hz peak.

DannyBadorine

  • Full Member
  • Posts: 376
Re: Thoughts on these graphs...
« Reply #6 on: 14 Feb 2022, 03:36 am »
Treating the room with 6" thick Rockwool sound treatment panels could help a bit, especially if you put them on the ceiling hanging with a few inches space.  It really seems like there is a lot of extra low end from the woofers of the X-Statiks.  It's almost as if they are turned up louder than the mids. 
Measure the left speaker and the right speaker separately and make sure that they are measuring close to the same.

JWL.GIK

  • Facilitator
  • Posts: 132
    • GIK Acoustics
Re: Thoughts on these graphs...
« Reply #7 on: 14 Feb 2022, 02:29 pm »
Nice work thus far!

When looking at room data, I actually don't usually spend much time looking at flat graphs.... I'm much more interested in the time-domain measurements (Spectrogram, waterfall graphs, ETC/Impulse, RT60 etc) as these give us a lot more info about what the room actually sounds like. Make sure you are also looking at the waterfall graphs too -- you sometimes see strange things like a null but also a resonance at a specific frequency, that won't show up in a flat response graph.

But you are definitely on the right track -- even in an untreated room REW is useful for placement. There is a relationship between many of the peaks/nulls and the positioning of each speaker and nearby boundaries (walls/ceiling/floor), not to mention the subwoofer electronics (phase, crossover slopes/freqs etc).

Once you get the setup dialed in, treatments (bass traps) are the real game-changer.

DannyBadorine

  • Full Member
  • Posts: 376
Re: Thoughts on these graphs...
« Reply #8 on: 14 Feb 2022, 04:16 pm »
you sometimes see strange things like a null but also a resonance at a specific frequency, that won't show up in a flat response graph.


Would a null and resonance at the same frequency show that there is significant phase cancellation at that frequency?  Maybe it's a null from the ceiling height and resonance from a wall? 

WGH

Re: Thoughts on these graphs...
« Reply #9 on: 14 Feb 2022, 04:24 pm »
....I had the subs crossed at 98 Hz @ 24 dB slope. They're currently at 72 Hz.

Why is the crossover frequency set so high? The X-Statics are -3db down at 48Hz for an average room.

My speakers are -3db down at 34Hz and my sub's crossover is set to 30Hz. The overlap between the speakers and sub is seamless and the sub doesn't overload the room. I only notice the sub when there is really low frequencies, the rest of the time it stays out of the way. The only way I know the sub is turned on is the recording's soundfield is larger and includes more low level information like room echo.

Housteau

Re: Thoughts on these graphs...
« Reply #10 on: 14 Feb 2022, 04:49 pm »
Since you have a finished room I would do exactly as you are doing now, find the best locations for the speakers and listening position for both imaging and bass response.  In an untreated room like this it becomes DSP time.  Drop the peaks between 45 and 125Hz to be more level with the frequencies above them.  Then drop the peak below 35Hz.  You will now have a much smaller dip at 40Hz and be much smoother every place else.  Now you can play with room treatment to dial in your imaging.  But, use very thick absorption at the reflective zones to also aid in the bass control.  When that is done you can reduce the DSP corrections if needed.

To correct a dip at 40Hz requires a lot of treatment that you may not have the space for.  That is why I left it for last.  It is time to first find out what is possible.  I would go to Lowes and buy bundles of mineral wool, usually 4' x 2' x 16" for around 50-$60.  Buy quite a few and remember that you can return them for a full refund.  These are just temporary tools.  There is no need to remove their plastic because we are only concerned about bass.  Now place them in stacks around the room, such as the corners.  Remember that we are not concerned at this point about what is practical, just what is possible.  Depending upon the results of your experiments you can decide on what you want to do.  If it works you can keep some of that material and create your own controls, or return it all and go commercial.

Tyson

  • Full Member
  • Posts: 11110
  • Audio - It's all a big fake.
Re: Thoughts on these graphs...
« Reply #11 on: 14 Feb 2022, 06:37 pm »
Since you have a finished room I would do exactly as you are doing now, find the best locations for the speakers and listening position for both imaging and bass response.  In an untreated room like this it becomes DSP time.  Drop the peaks between 45 and 125Hz to be more level with the frequencies above them.  Then drop the peak below 35Hz.  You will now have a much smaller dip at 40Hz and be much smoother every place else.  Now you can play with room treatment to dial in your imaging.  But, use very thick absorption at the reflective zones to also aid in the bass control.  When that is done you can reduce the DSP corrections if needed.

To correct a dip at 40Hz requires a lot of treatment that you may not have the space for.  That is why I left it for last.  It is time to first find out what is possible.  I would go to Lowes and buy bundles of mineral wool, usually 4' x 2' x 16" for around 50-$60.  Buy quite a few and remember that you can return them for a full refund.  These are just temporary tools.  There is no need to remove their plastic because we are only concerned about bass.  Now place them in stacks around the room, such as the corners.  Remember that we are not concerned at this point about what is practical, just what is possible.  Depending upon the results of your experiments you can decide on what you want to do.  If it works you can keep some of that material and create your own controls, or return it all and go commercial.

This is excellent advice.

Housteau

Re: Thoughts on these graphs...
« Reply #12 on: 14 Feb 2022, 08:21 pm »
This is excellent advice.

I have actually given this a lot of thought for myself.  A friend of mine recently lost his entire home due to a horrible catastrophe.  He is starting from scratch, but also looking at it as on opportunity to rebuild exactly what he wants.  I had wondered what I would do in his situation.  Even if I would rebuild to a room with an ideal ratio and similar to what I have now, that would still just be the jumping off point.  Before I even considered what kind of system I would buy, I would work on that bare room until the bass response met my expectations.  I would probably just pick up some decent subwoofers to use as tools to chart the room as I went.  I would first start with the easy way and see if the soft velocity style treatment materials could do the trick, as mentioned above.  Then, I would move on to the heavy duty diaphagramatic methods if needed.

Chops

Re: Thoughts on these graphs...
« Reply #13 on: 15 Feb 2022, 03:04 am »
Nice work thus far!

When looking at room data, I actually don't usually spend much time looking at flat graphs.... I'm much more interested in the time-domain measurements (Spectrogram, waterfall graphs, ETC/Impulse, RT60 etc) as these give us a lot more info about what the room actually sounds like. Make sure you are also looking at the waterfall graphs too -- you sometimes see strange things like a null but also a resonance at a specific frequency, that won't show up in a flat response graph.

But you are definitely on the right track -- even in an untreated room REW is useful for placement. There is a relationship between many of the peaks/nulls and the positioning of each speaker and nearby boundaries (walls/ceiling/floor), not to mention the subwoofer electronics (phase, crossover slopes/freqs etc).

Once you get the setup dialed in, treatments (bass traps) are the real game-changer.

Thank you!

Also, I've got those graphs as well...


Chops

Re: Thoughts on these graphs...
« Reply #14 on: 15 Feb 2022, 03:11 am »
Why is the crossover frequency set so high? The X-Statics are -3db down at 48Hz for an average room.

My speakers are -3db down at 34Hz and my sub's crossover is set to 30Hz. The overlap between the speakers and sub is seamless and the sub doesn't overload the room. I only notice the sub when there is really low frequencies, the rest of the time it stays out of the way. The only way I know the sub is turned on is the recording's soundfield is larger and includes more low level information like room echo.

Although true, you can clearly see that in this room, the X-Statik's drop like a rock after 74Hz, hence the higher than normal crossover point on the subs. Luckily, these new SVS subs are extremely controlled and detailed, so they have no issues reaching up that high. And as such, the subs do in fact disappear, not drawing attention to themselves at all.

This coming Saturday my family and I are going to the Florida Audio Expo, and work this week is nasty busy, so I wont be able to do more tweaking until Sunday.

Chops

Re: Thoughts on these graphs...
« Reply #15 on: 15 Feb 2022, 03:19 am »
Since you have a finished room I would do exactly as you are doing now, find the best locations for the speakers and listening position for both imaging and bass response.  In an untreated room like this it becomes DSP time.  Drop the peaks between 45 and 125Hz to be more level with the frequencies above them.  Then drop the peak below 35Hz.  You will now have a much smaller dip at 40Hz and be much smoother every place else.  Now you can play with room treatment to dial in your imaging.  But, use very thick absorption at the reflective zones to also aid in the bass control.  When that is done you can reduce the DSP corrections if needed.

To correct a dip at 40Hz requires a lot of treatment that you may not have the space for.  That is why I left it for last.  It is time to first find out what is possible.  I would go to Lowes and buy bundles of mineral wool, usually 4' x 2' x 16" for around 50-$60.  Buy quite a few and remember that you can return them for a full refund.  These are just temporary tools.  There is no need to remove their plastic because we are only concerned about bass.  Now place them in stacks around the room, such as the corners.  Remember that we are not concerned at this point about what is practical, just what is possible.  Depending upon the results of your experiments you can decide on what you want to do.  If it works you can keep some of that material and create your own controls, or return it all and go commercial.

I have a dbx DriveRack Venu 360, but I'd rather not use it. I always prefer doing my tuning via passive means such as speaker/sub locations and crossover/DSP settings within the subs themselves. Then after that, room treatments.

Again, I'm not concerned about the 40Hz issue that much. I can do more tuning with the subs DSP to reduce that hole more. My main concern is that 74Hz peak. I need to figure that one out and do some more experimenting with locations and such.

WGH

Re: Thoughts on these graphs...
« Reply #16 on: 15 Feb 2022, 05:56 am »
Room is 21.8 ft long, 13.6 ft wide, and an 8 ft ceiling...

Oops, I missed the label on the first graph. It might not be the X-Statics that are causing the big hump at 74Hz but where you are sitting.


Find the free Harman calculator at the bottom of the first post
https://www.audiocircle.com/index.php?topic=58304.0

And a online calculator
https://www.bobgolds.com/Mode/RoomModes.htm


youngho

Re: Thoughts on these graphs...
« Reply #17 on: 15 Feb 2022, 05:02 pm »
Is the first graph the average of the left and right speaker tested separately? Similarly for the second but with the left speaker and left sub together averaged with right speaker and right sub? How far from the front wall do you sit?

In theory, the midline of the room would represent a node for the ~41.5 Hz first-order width mode, but this would be expected cancel by dual mono subs. With speakers located 6' from the wall behind them, you would expect a SBIR cancellation at 47 Hz, which you can see in the first graph, goes away in the second because the subs don't have that issue. You mentioned that the speakers are 6' from the front wall and ~3' from the wide walls, so assuming an equilateral triangle setup with the speakers spaced about 7.5' apart, that might put about 12.5' from the front wall. WGH already mentioned that the third-order length mode might be an issue, which corresponds to ~78 Hz. One possibility would be to try moving the speakers back so that they're 3.63' from the front wall, and/or moving the listening position forward two feet or so.

WGH

Re: Thoughts on these graphs...
« Reply #18 on: 15 Feb 2022, 06:33 pm »
Part 2 of "Maximizing Loudspeaker Performance in Rooms" has detailed information on how to interpret the axial standing wave graphs.

Maximizing Loudspeaker Performance in Rooms Part 2 - The Acoustical Design of Home Theaters
by Floyd E. Toole, Ph.D.
Acoustical Design and Equalization
MaximizingLoudspeakerPerformanceInRooms.pdf

Here is an example from the article:

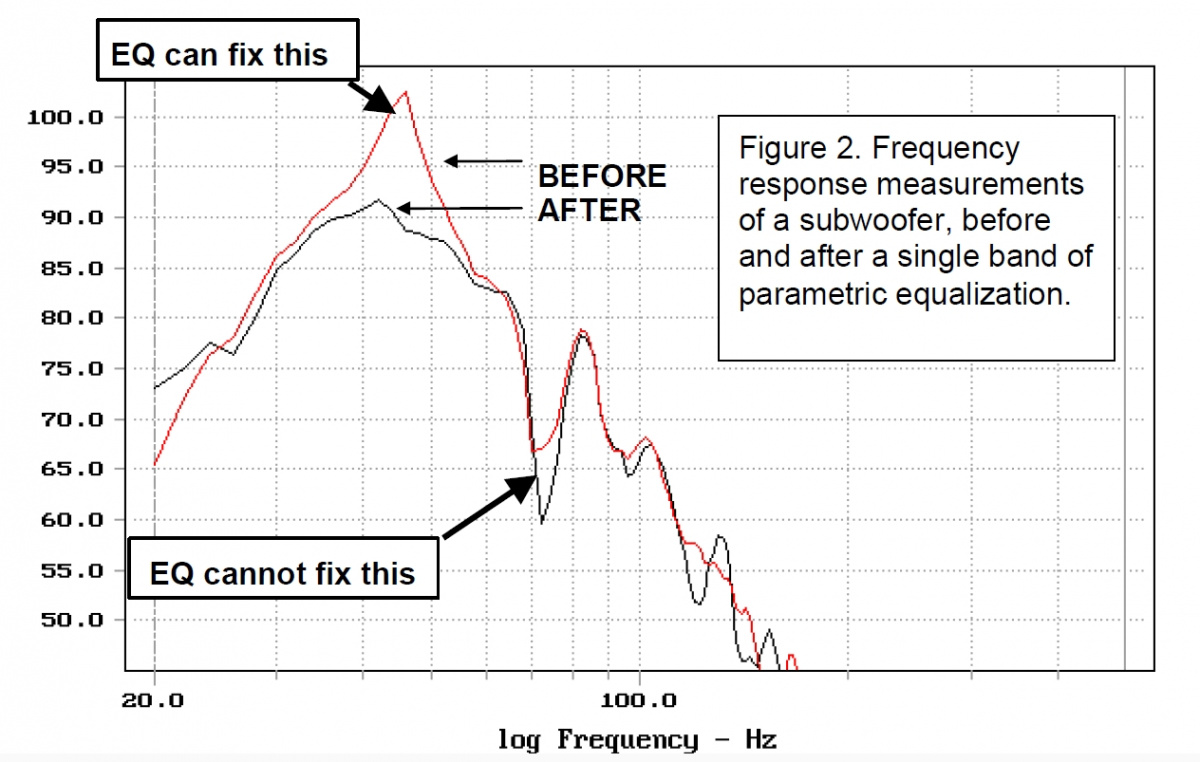
Figure 2 shows what we measured for the subwoofer, by itself and, as predicted, there
was a prominent peak right around 47 Hz. When we listened, the bass was flabby and
boomy, with a “one-note” quality. Even movie explosions sounded faked. To address
this problem we dialed in a single parametric filter, set to 47 Hz, with the appropriate
bandwidth, or Q, and simply turned the resonance down. Room resonances at low
frequencies behave as “minimum phase” phenomena, and so, if the amplitude vs.
frequency characteristic is corrected, so also will the phase vs. frequency characteristic.
If both amplitude and phase responses are fixed, then it must be true that the transient
response must be fixed – i.e. the ringing, or overhang, must be eliminated. Figure 3
shows that this is so. Equalization of the right kind can work. Notice that we completely
ignored the acoustical cancellation dip at about 73 Hz.


Mike-48

Re: Thoughts on these graphs...
« Reply #19 on: 16 Feb 2022, 07:18 pm »
... see quoted post with illustration of EQ results ...
The peak is still +10 dB relative to the next highest bass peak. I agree it's an improvement, but it's curious that no attempt was made to reduce the peak by another 10 or 15 dB to better blend with the surrounding frequencies. Thoughts?